
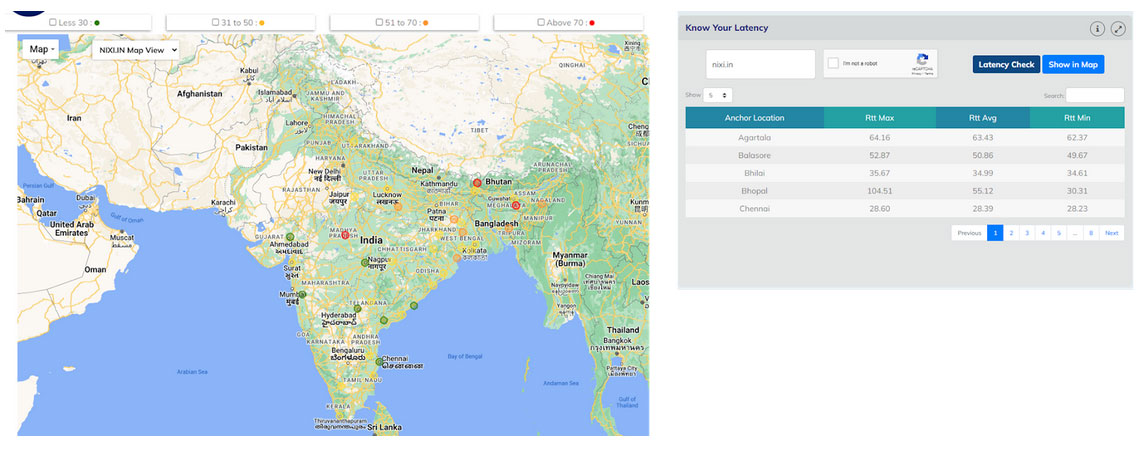
Know your latency
Explore web service and IP resource latency from over 100 anchor locations with a simple click. Just enter the IP address or domain name to instantly access latency information. This tool empowers users to make informed decisions when selecting a hosting provider, based on performance metrics across different regions. Historical data is also accessible, providing insights into past performance trends
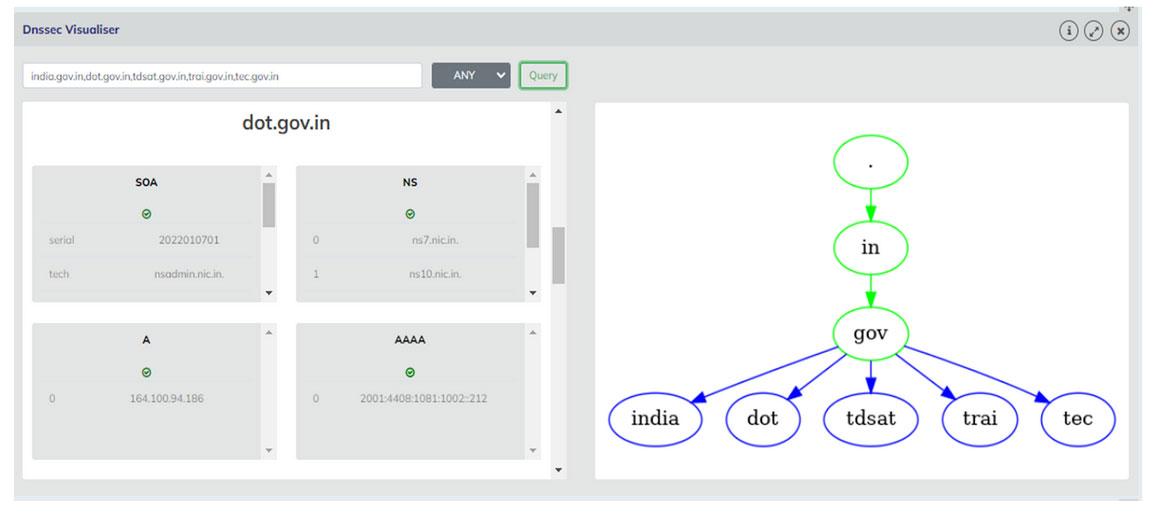
DNSSEC Visualizer
Visualize multiple DNS services for DNSSEC readiness, creating graphical representations of DNS trees that display various service endpoints. Historical data is accessible for tracking performance trends over time. Users can schedule periodic runs on specific targets to ensure ongoing monitoring and optimization
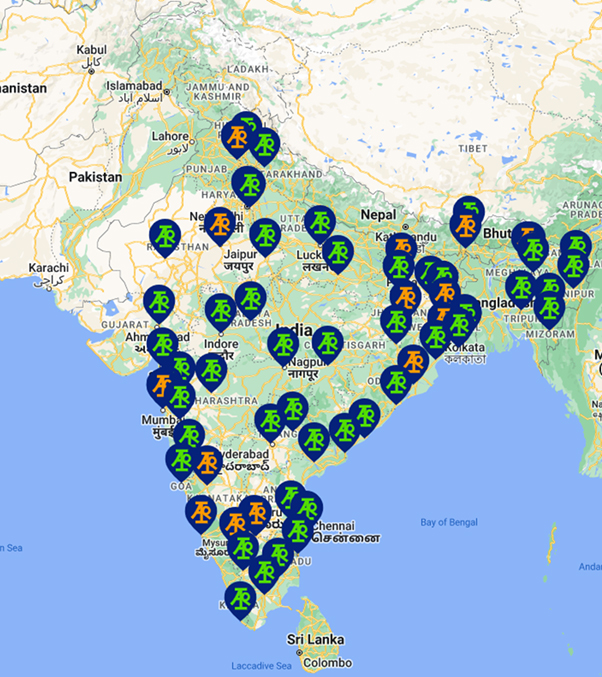
Anchor Locations
Displays anchor locations with visual cues: green symbols indicate IPv6 locations, while orange symbols denote IPv4 locations. The portal provides comprehensive IP/ASN and geolocation details for each anchor.
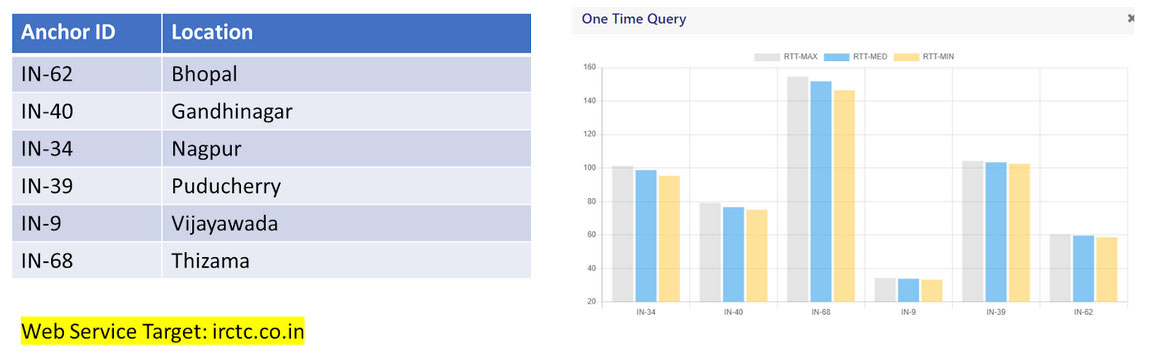
Latency of services (ping) [Source – Single] refers to the measurement of the round-trip time taken for data packets to travel from a single source location to a specified destination and back again. This metric is essential for assessing the responsiveness and performance of network services, providing insights into the efficiency of data transmission over the network. By conducting ping measurements from a single source, users can accurately gauge the latency experienced by end-users or devices accessing web services, applications, or servers. This data helps in identifying potential bottlenecks, optimizing network configurations, and ensuring a seamless user experience across different geographical locations.
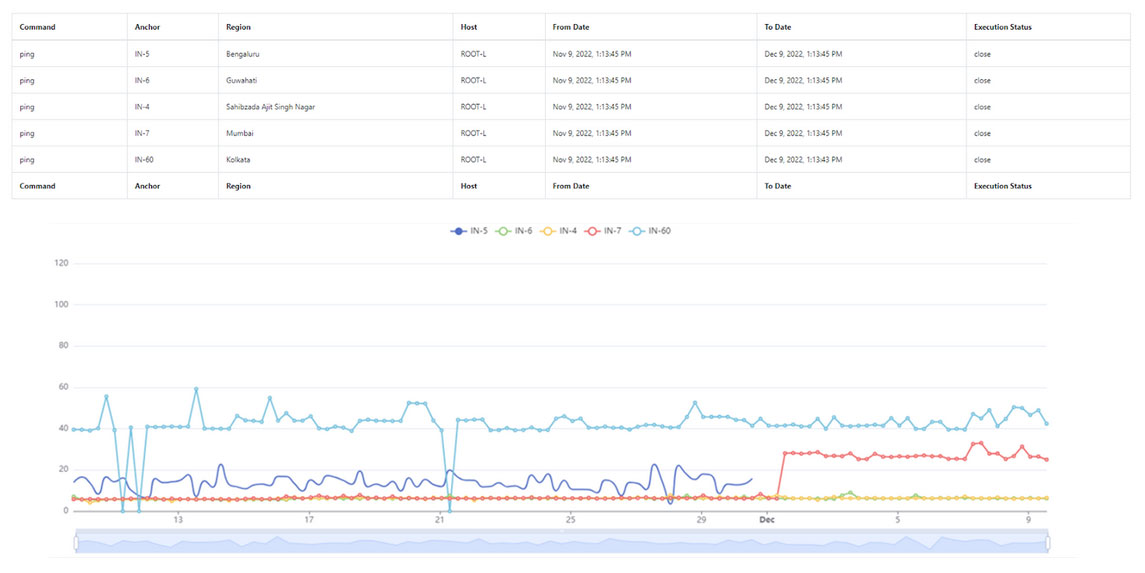
Latency of services (ping) [Source – Multiple] involves measuring the round-trip time for data packets from multiple source locations to a specified destination and back. This approach provides a comprehensive view of network performance across various geographical points, allowing for a more robust assessment of latency and reliability. By conducting ping measurements from multiple sources, users can analyze how latency varies depending on the origin of requests, identify regional disparities, and optimize network routing to improve overall responsiveness. This data is crucial for ensuring consistent service delivery, enhancing user experience, and addressing performance issues proactively
Latency of services (ping) [Source – Single][Periodic]
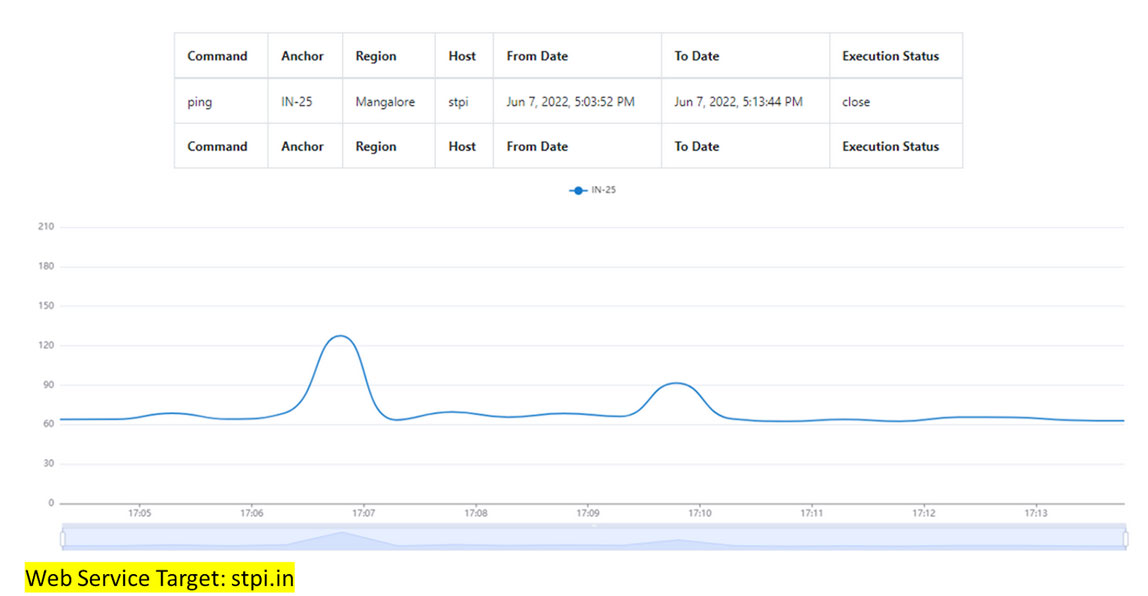
Latency of services (ping) [Source – Single][Periodic] involves regularly scheduled measurements of round-trip times from a single source location to specific destinations. This approach enables continuous monitoring of network performance over time, offering insights into latency trends, fluctuations, and potential issues that may affect service reliability. By periodically conducting ping measurements from a single source, organizations can track changes in latency, assess the impact of network upgrades or modifications, and ensure consistent service levels for end-users. This proactive monitoring helps in optimizing network configurations, identifying and resolving latency-related challenges, and maintaining a high standard of performance across distributed environments.
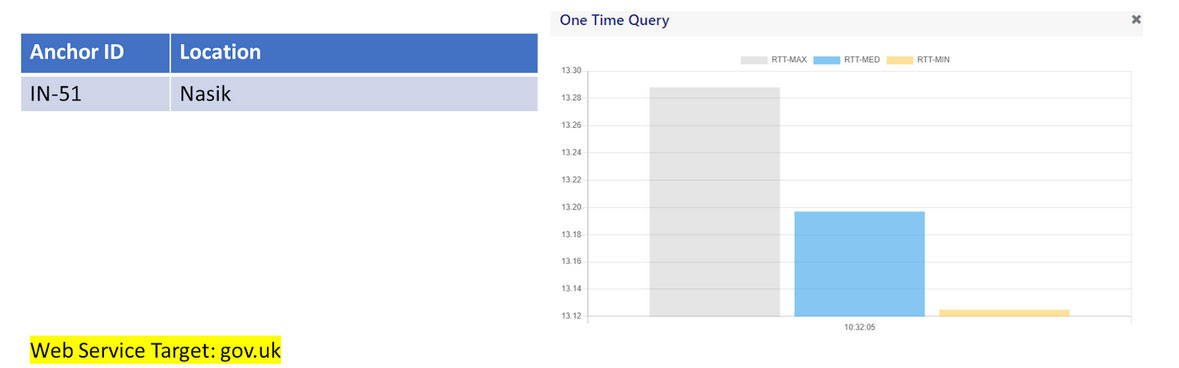
Tracing the route (traceroute) [Source – Single, One time] involves a one-time measurement from a single source location to trace the path that data packets take to reach a specified destination. This method provides valuable insights into the network infrastructure and routing paths between the source and destination. By executing a traceroute, users can identify each intermediate hop (router) along the path, measure latency between hops, and detect potential points of congestion or network inefficiencies. This data is essential for troubleshooting connectivity issues, diagnosing routing problems, and optimizing network performance. A single, one-time traceroute measurement offers a snapshot view of the current routing dynamics, aiding in network management and ensuring efficient data transmission.
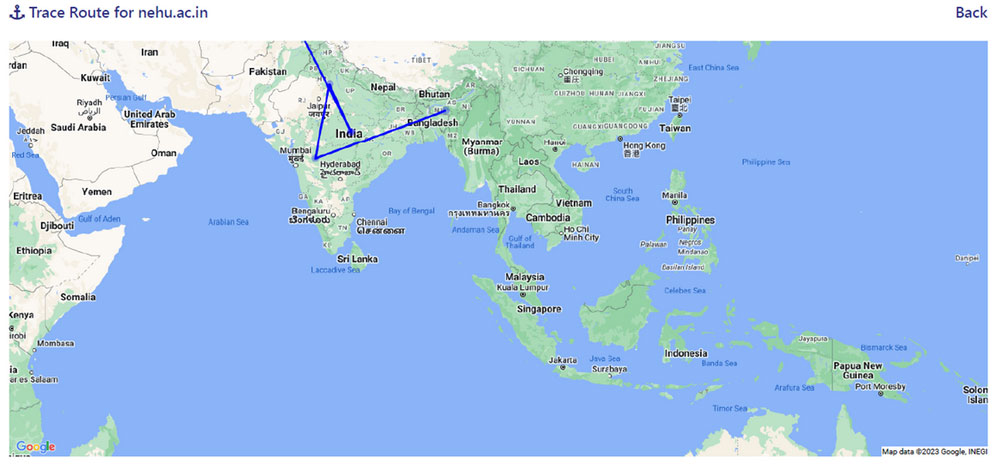
Tracing the route (traceroute) [Source – Multiple, One time] involves conducting a one-time traceroute measurement from multiple source locations to a specified destination. This approach provides a comprehensive view of the network path taken by data packets from different geographical points to reach their destination. By executing traceroutes from multiple sources, users can analyze and compare the routing paths, identify variations in latency between different locations, and pinpoint potential bottlenecks or inefficiencies in the network infrastructure.
This method is particularly valuable for understanding the geographic distribution of network performance, assessing the consistency of routing across diverse regions, and diagnosing issues that may impact service availability or latency. By gathering data from multiple traceroute measurements, organizations can gain insights into the resilience of their network architecture, optimize routing configurations, and ensure a reliable and responsive user experience across distributed environments.

DNS measurements from user endpoint
The AIORI Internet Measurement infrastructure facilitates the analysis of DNS resiliency from user endpoints, focusing on the availability and latency of the hierarchy. This report is instrumental for enhancing resiliency efforts by zone maintainers across different regions.
Measurement: A record for meity.gov.in
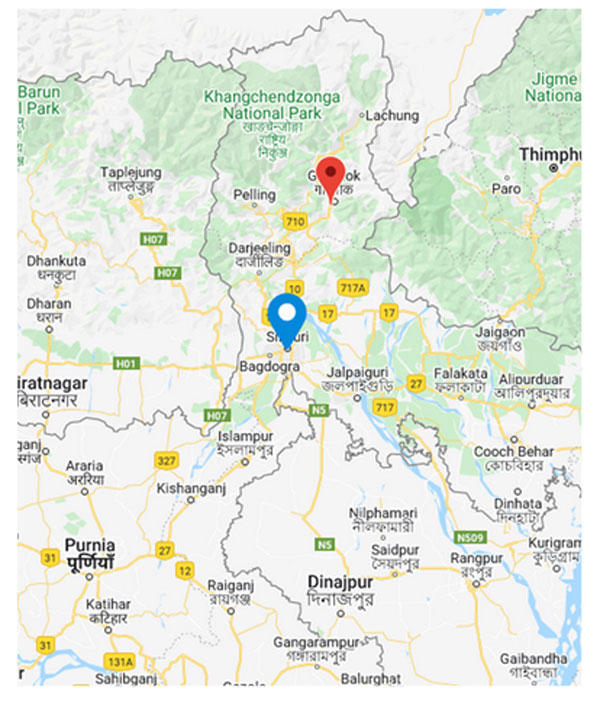
Location: Guwahati Anchor
Root Servers availability With the deployment of the L root server in Guwahati, latency is minimized to [6.21 ms], whereas the highest latency is observed for the E root server [339.43 ms].
Measurement: A record for meity.gov.in
Location: Guwahati Anchor
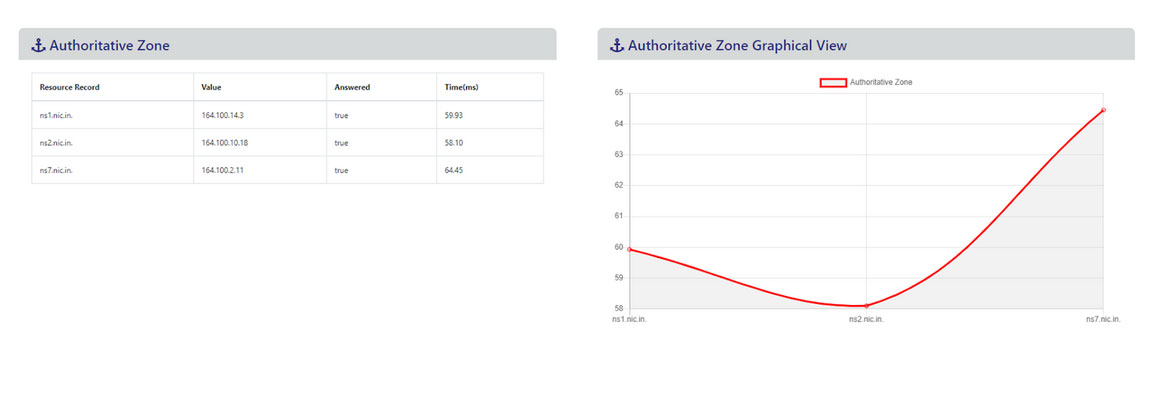
Zone: Root [.]
Measurement : meity.gov.in A record
Location : Guwahati Anchor
Zone : [meity.gov.in.]
In conclusion, the reports provided by AIORI.IN offer valuable insights into network performance and infrastructure resilience. By leveraging comprehensive measurements such as latency analysis, DNS readiness assessments, and route tracing, users can effectively monitor and optimize their digital services. These reports not only aid in identifying potential issues and bottlenecks but also support proactive measures for enhancing service availability and responsiveness. With access to historical data and visualization tools, stakeholders can make informed decisions, streamline operations, and ensure a seamless user experience across diverse geographical locations. AIORI.IN continues to play a pivotal role in advancing network monitoring capabilities, fostering resilient internet services, and driving continuous improvement in digital infrastructure management.