Root Servers DNS Query Latency Visualizer
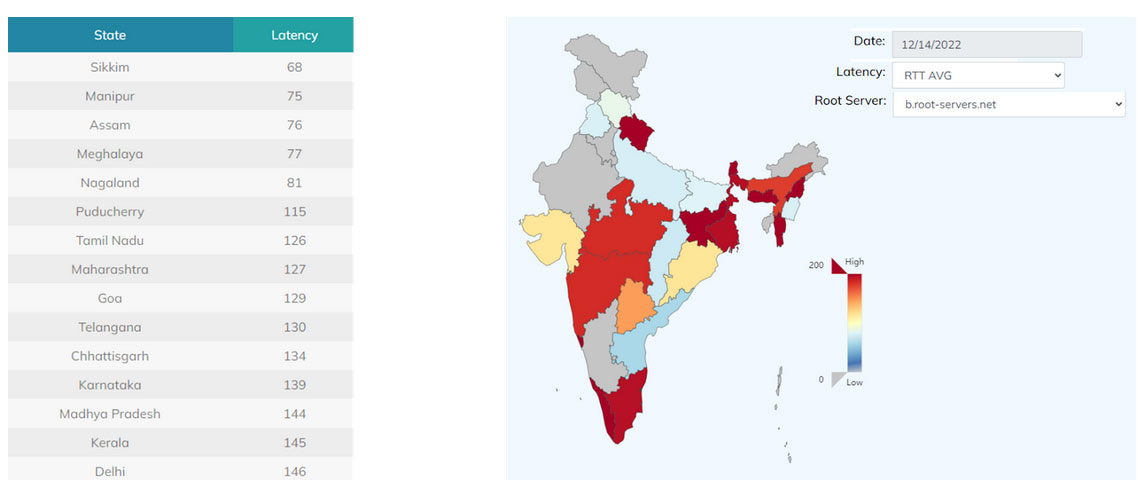
The Root Server DNS Latency Map Visualizer provides a comprehensive view of DNS latency across various regions, allowing stakeholders to monitor and analyze performance metrics in real-time. This tool aggregates data from multiple root servers, presenting latency metrics visually on a geographical map. By visualizing latency trends and fluctuations, users can quickly identify areas experiencing higher latency, pinpoint potential routing inefficiencies, and assess the overall health of DNS resolution infrastructure. Historical data enables trend analysis and benchmarking, aiding in proactive optimization and troubleshooting efforts to enhance the reliability and responsiveness of DNS services globally.
You can view the Root Server DNS Latency Map Visualizer Measurement report directly on the AIORI home page at https://aiori.in. Here are the key features of the report:
- Continuous Measurement: Measurements are taken at different intervals throughout the day, providing real-time insights into root server latency.
- Historical View: Historical data dating back to April 2022 is available, allowing for trend analysis and performance evaluation over time.
- State-wise Visualization: The latency data is visualized state-wise, offering a geographical perspective on server performance across different regions.
- Raw Data Availability: Raw data, including DNS SOA Command and ICMP Ping command results, is accessible for research and optimization purposes.
- Geolocation Information: Detailed information such as origin AS number and IP addresses with IP geolocation of all anchors is provided, enhancing the granularity of analysis.
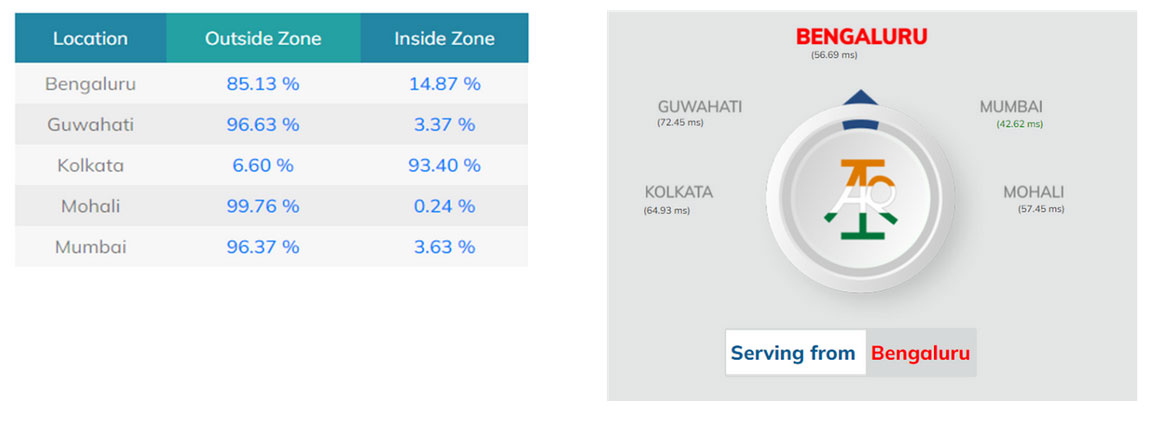
Routing de-tour measurement of anycast services
The AIORI portal is hosted using the same Anycast IP for WWW and DNS in multiple locations. Users visiting the site contribute to analyzing routing latency measurement data, which utilizes ICMP (Ping), DNS, and HTTP/HTTPS protocols to assess availability. Historical data is accessible for studying routing and peering states, aiding in proposing fixes for a more resilient and responsive Internet service experience.
We’ve geolocated IPs within a 200 km radius to define a server’s local zone. At AIORI.IN, we analyze incoming requests from this zone (coming to servers inside zone and to outside anycast instances) to assess routing, peering conditions, and identify any underlying issues.