As modern networks scale, the boundary between application performance and network behavior grows blurry. Network performance issues are notoriously hard to pinpoint. A web page loads slowly, but is it the DNS resolution, the server, the network? Often, the tools used to answer these questions are built on guesswork and indirect probes. RFC 8250, however, proposes something far more strategic, i.e. embedding timing diagnostics directly inside IPv6 packets.
This blog is a technical walkthrough of how Performance and Diagnostic Metrics defined in [RFC 8250] is implemented in a Linux kernel module, and how the entire application layer network stack can run on top of it. The goal is high-precision, low-noise, protocol-agnostic performance measurement, without needing any clock synchronization or special hardware.
Network Latency Without Visibility
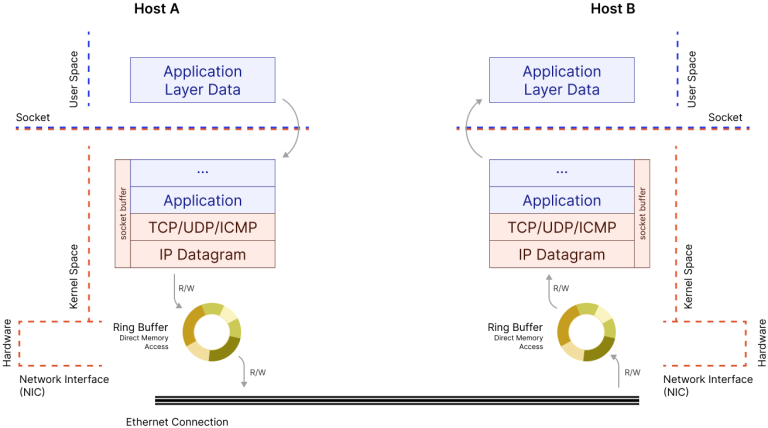
Whenever data moves across a network, say, a DNS query to resolve a domain name, it passes through multiple layers of software and hardware. From the application issuing the request, through the operating system’s networking stack, down to the network interface card and into the network itself, as shown in Fig 1. Once the packet arrives at the destination, the process happens in reverse.
Now, imagine trying to understand where in that path the delay happened. Was the application slow to send? Did the server take too long to process? Was the network congested? Most of the time, these questions go unanswered because there’s no visibility built into the path itself, making the localization of the point of high latency tricky.

As the figure Fig 1 illustrates, while packets traverse the operating system’s layers and are managed in memory buffers, there’s no built-in mechanism to record timestamps or associate related packets. There’s no breadcrumb trail inside the system for measuring timing across this path.
RFC 8250
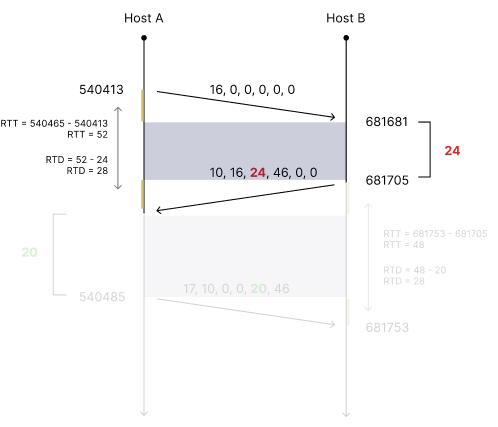
RFC 8250 proposes a better solution for performance measurements by allowing IPv6 packets to carry Performance and Diagnostic Metrics (PDM) directly within them. Assuming a request-response based protocol, say a pair of DNS packets, the request IPv6 packet is enriched with a blank PDM Extension Header, with only a sequence number (like a tracking ID), While the response from the server is enriched with the previous sequence number, a new sequence number, and the time taken by the server.
As shown in Fig 2, The first packet sent from the Client (Host A) contains a PDM header with only its packet id 16 at timestamp 540413. The Server (Host B), sends back the response packet at timestamp 681705, containing a PDM header with the previous packet id 16, current packet id 10, and the server latency of 24 units, jointly represented by the deltatlr and the scaledtlr, i.e. (24, 46).
This, paired with the timing information in Client (Host A), can be used to calculate the network latency (RTD) of 28 units as well.
By comparing these values, both the systems can exchange:
- Server Processing Delay: How long a system spent on the request.
- Network Delay: The time spent in transit (RTT minus processing time).

This approach doesn’t require synchronized clocks as this RFC works on time delta instead of timestamp. This approach also doesn’t require the PDM support from routers in between, although it does require the network to be fully IPv6 enabled without any translation technology (NAT64 or NAT46) in between as those technologies do not usually support IPv6 Extension Headers, and may result into dropping of the IPv6 Packet entirely.
Unlike TCP timestamps or ICMP round trips, RFC 8250’s PDM is stateful but agnostic to application protocols. It uses IPv6’s Destination Options header to carry a compact 16-byte structure per packet, just enough to measure round-trip time (RTT), round-trip delay (RTD), and server-side processing latency.
But PDM is just a spec. The real question is: where should it be implemented?
Implementing the Protocol
In our case, the PDM logic is implemented in the Linux Netfilter framework inside the kernel. By embedding timing measurements at RX and TX hooks, the server can record timestamps with attoseconds precision, correlate requests with responses, and attach diagnostics on the wire.
The implementation of PDM within the Linux kernel is divided into two parts:
- RX path: for handling incoming packets and recording diagnostic anchors
- TX path: for handling outgoing packets and embedding timing information into the response
The RX logic is triggered through a Netfilter hook at NF_INET_LOCAL_IN, which intercepts IPv6 packets after they’ve been received by the system but before they are handed off to the userspace application.
When a packet with a PDM extension header arrives, the kernel module:
- Parses the packet and extracts the PDM header.
- Identifies the protocol and packet chain, such as a DNS query using its transaction ID.
- Captures the current timestamp using ktime_get_real_ns() serving as a precise marker of when the packet entered the system.
- Stores the information in a custom datatype segmented hashmap, meant for fast in-kernel structure organized by protocol type (e.g., DNS, TCP, etc.).
The segmented hashmap acts as a temporary registry of packets that are “in-flight”, those for which a response is expected later. It avoids linear searches and uses direct indexing by protocol + identifier, making the time complexity constant.
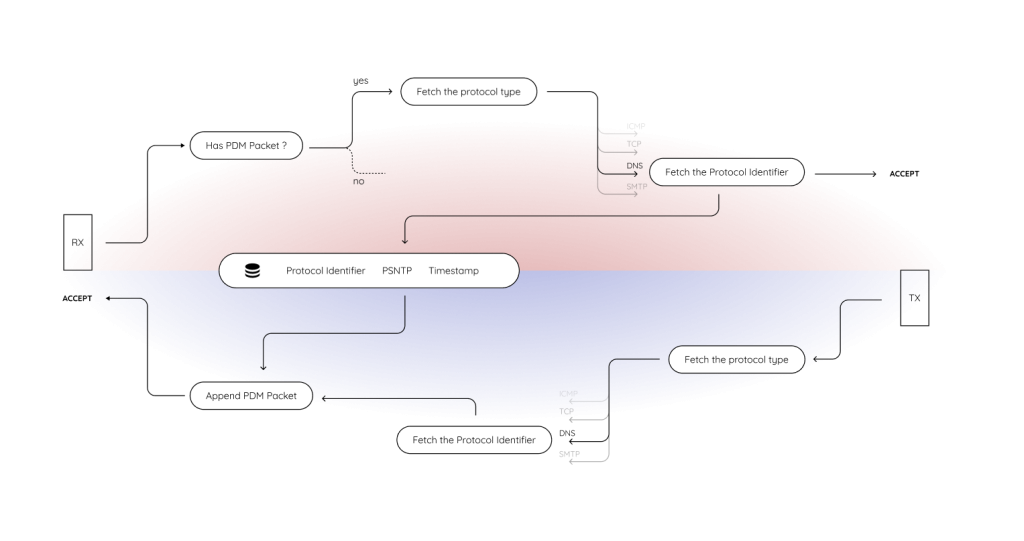
This part corresponds to the right half of Fig 1. where packets are received as socket buffers (sk_buff), but typically disappear into the application layer with no diagnostic footprint. With the RX logic in place, the kernel now tags these incoming packets with context and time as seen in the top half of Fig 3.

The TX hook, registered at NF_INET_LOCAL_OUT, activates when a packet is being sent out from the local system.
When the application responds to a previous request for example, sending a DNS reply the kernel module intercepts the outgoing packet and:
- Parses the packet and extracts its protocol identifier (e.g., the DNS transaction ID).
- Checks the segmented hashmap for a corresponding entry recorded earlier in the RX path.
- Computes the time delta between RX and TX.
- Converts the time delta into a scaled form, using custom logic (as referred in the source RFC) to fit large time values into 16-bit fields.
- Constructs a new PDM header, populating fields such as psntp (packet sequence number), deltatlr and scaledtlr (delay since last reception), and leaves placeholders for client-returned timing fields (to be filled in later)
- Injects this header into the outgoing packet by manipulating the sk_buff by ensuring enough tailroom using pskb_expand_head(), then shifting the packet payload forward with memmove()and writing the new PDM header into the space just after the IPv6 header, as shown in Fig 4.

This corresponds to the left half of Fig 1 where outgoing packets are written into the socket buffer and pushed to the network interface. Now, before transmission, they carry self-reported diagnostic timing data embedded directly into the packet itself, by following the logic in the bottom half of Fig 3.
By stitching together RX and TX with a shared registry and deterministic packet identifiers, the system enables round-trip diagnostics directly inside the protocol stack, without requiring external logging, packet captures, or synchronized clocks.
The entire code for the server side RFC8250 (for Linux systems only) is available at https://github.com/indiainternetfoundation/IPv6PerformanceDiagnosticMetric
On the client’s side, the protocol loads in the user space application, as it only needs the RTT to be measured. An open source implementation of the client (for Linux systems only) can be installed simply by using
$ pip install git+https://github.com/indiainternetfoundation/py_measure_dns
This package uses the same structure as of dnspython, but before sending it to-wire, it has the capability to add PDM Extension Header, as well as receiving PDM Header from a response.
					from measure_dns import DNSQuery, send_dns_query, DNSFlags

# Define the domain to be queried
domain = "testprotocol.in"

# Define the DNS server to query (IPv6 addresses of authoritative nameservers)
dns_server = "2406:da1a:8e8:e863:ab7a:cb7e:2cf9:dc78"  # ns1.testprotocol.in

result = send_dns_query(
        DNSQuery(qname=domain, rdtype="A"),  # Querying A record for domain
        dns_server,
        DNSFlags.PdmMetric  # Requesting PDM option
)

# Check if a response was received
if result:
    print(f"Latency: {result.latency_ns} ns")  # Print query response latency
    print(result.response.answer)  # Print DNS response
else:
    print("Failed to get a response.")  # Indicate query failure
The result, given that the DNS server is PDM enabled, will have additional_params that contain the PDM information, as shown below.
					    # Process additional DNS parameters if PDM option is present
    if result.additional_params:
        for option in result.additional_params:
            if option.option_type == 15:  # PDM option identifier
                pdm_option = option
                print()
                print(f"PDM Option Type: 0x{pdm_option.option_type:02x} ({pdm_option.option_type})")
                print(f"PDM Opt Len: 0x{pdm_option.opt_len:02x} ({pdm_option.opt_len})")
                print(f"PSNTP: 0x{pdm_option.psntp:02x} ({pdm_option.psntp})")
                print(f"PSNLR: 0x{pdm_option.psnlr:02x} ({pdm_option.psnlr})")
                print(f"DeltaTLR: 0x{pdm_option.deltatlr:02x} ({pdm_option.deltatlr})")
                print(f"DeltaTLS: 0x{pdm_option.deltatls:02x} ({pdm_option.deltatls})")
                print(f"Scale DTLR: 0x{pdm_option.scale_dtlr:02x} ({pdm_option.scale_dtlr})")
                print(f"Scale DTLS: 0x{pdm_option.scale_dtls:02x} ({pdm_option.scale_dtls})")
The pdm_option, received from the result.additional_params represents the raw PDM Extension Header and will need further processing to convert to known units like ms, ns, etc.
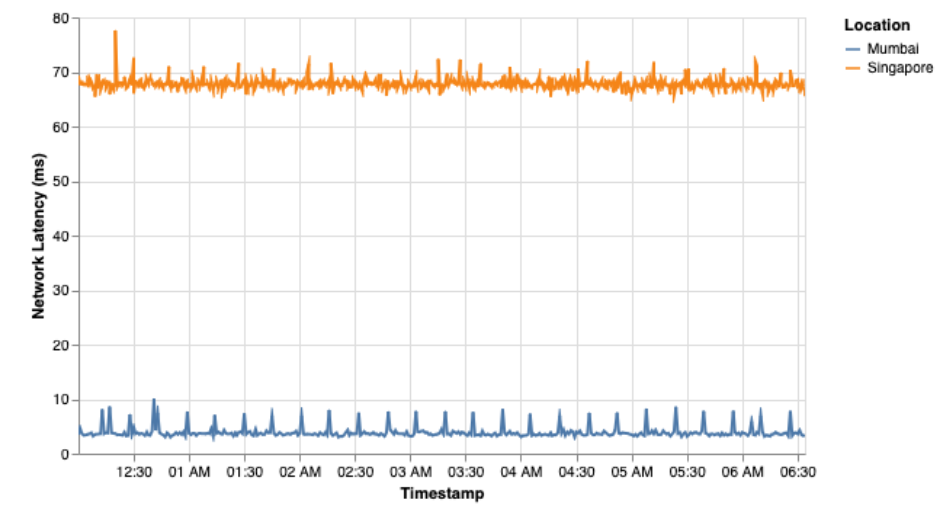
Once the PDM is successfully deployed, network features like network latency between 2 points can be measured as shown in Fig 5, where we measured network latency in AWS network, by deploying DNS authoritative servers in Mumbai and Singapore regions, and measuring RTT and RTD for the DNS queries.
Mumbai to Mumbai network latency (RTD) can be seen to be considerably lower, in a range of 4 – 10 ms, with consistent spikes and considerably lower noise where as, the Mumbai to Singapore network latency can be seen to be considerably higher, within the range of 65 – 73 ms, with more noise.

Both the server-side and client-side implementations are open source:
- Server-Side Kernel Module:
https://github.com/indiainternetfoundation/IPv6PerformanceDiagnosticMetric
- Python Client Library:
https://github.com/indiainternetfoundation/py_measure_dns
India Internet Foundation (IIFON) actively welcomes contributions to these repositories – whether it’s code, testing, docs, bug reports, or feature ideas. These efforts are part of a broader national initiative to make the Internet stack more observable, efficient, and intelligent.
This work has been carried out by the India Internet Foundation (IIFON) under the project AIORI (Advanced Internet Operations Research in India), supported by MeitY (Ministry of Electronics and Information Technology, Government of India).
It has also been formally presented at IETF 122. See the materials here.
Author
-

I am a researcher working on security, networks, protocols and DNS. I am a quantum computing enthusiast, a fan of Linux and an advocate for Free & Open Source Softwares. #FOSS
View all posts


